Steps to Upload a Census:
You can easily upload a census using an existing excel file you have completed with the required fields or download a template in the Verikai portal.
Video preview- How to Upload a Census
On the home page, click on 'create a new report' at the top left-hand side.

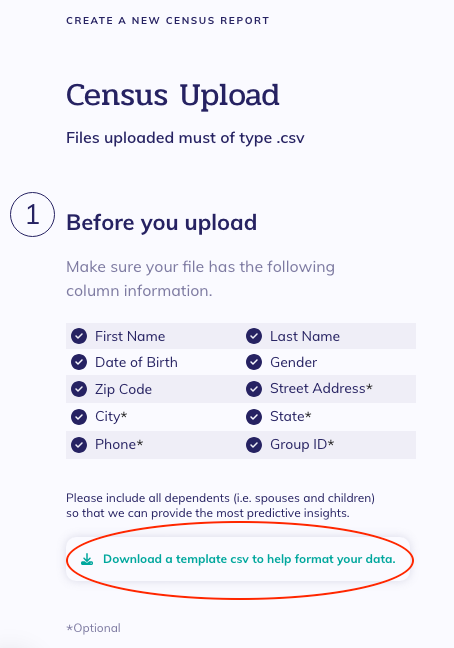
We require 5 data sets to upload:
• Date of Birth
• Gender
• Zip Code (5 digits)
• First name
• Last name
Optional Fields are:
• Phone Number
• State
• City
• Group ID
• *Street Address
*If you can also provide the Street Address in your upload, this will increase your match rates to 90-95%
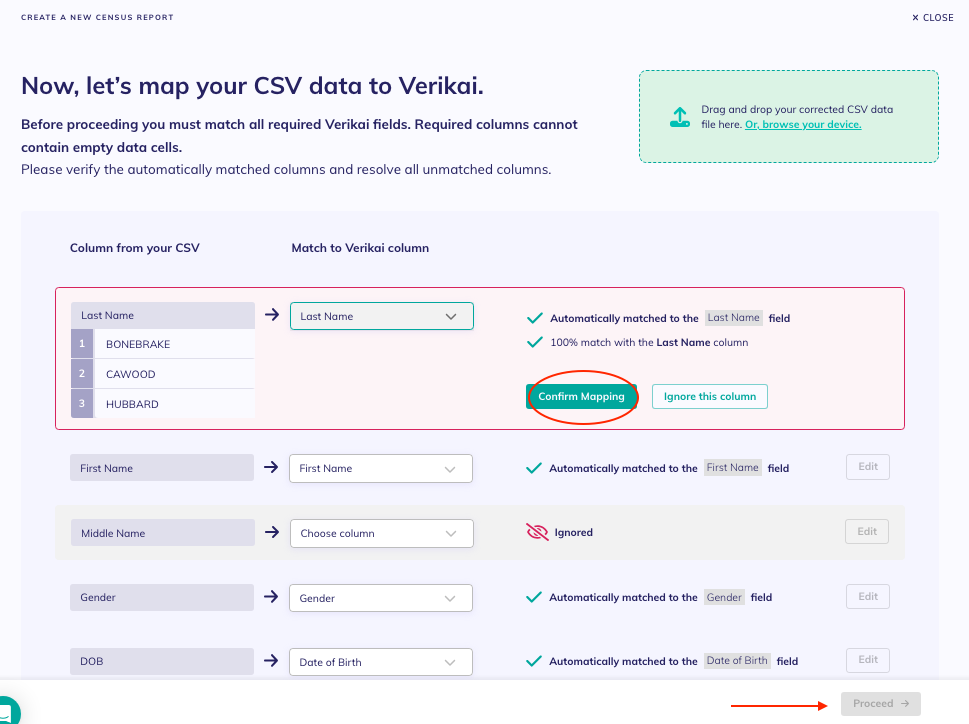
We provide smart match logic to match headers with similar names to the required fields (example: a file with a Birth Date in the header will match to the Date of Birth). Once all required fields are filled in, the "proceed" button at the bottom of the page will turn green and allow you to move forward.
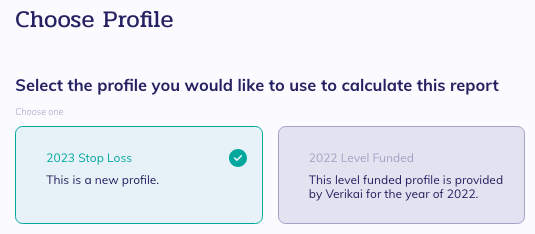
Next, you will choose your profile.
Once the report generates, the following page will display.
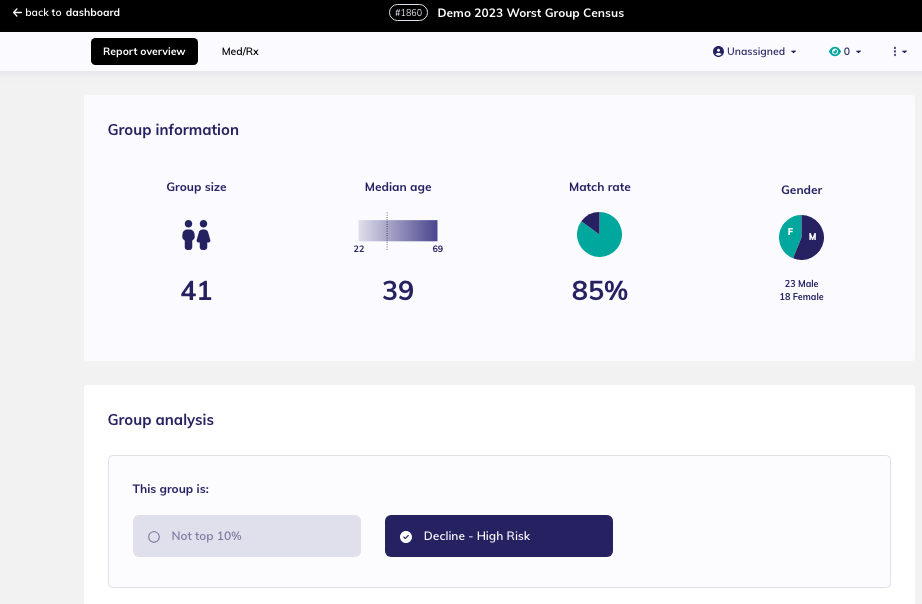
The dark purple highlighted box in the Capture Report will show you what scenario your group falls into. This output also shows you the group size, median age, match rate, and gender distribution. All individuals will be scored; our match rate shows individuals who have matched our clinical and behavioral data. This is also indicated in the column labeled “enhanced_behavioral” in the CSV export. You can navigate group and individual scores in the top navigation header; both tabs have an export option.
Our new explainability feature shows 'positive' and 'negative traits found in the risk assessment of this group.

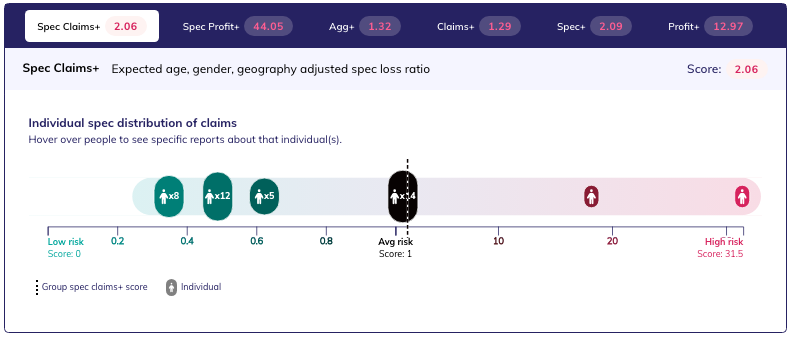
Located on the report overview page, 'Individual Scores Display' provides a
distribution chart of everyone’s Verikai scores. This visual representation allows you to quickly assess the spread of risk within the group, offering greater confidence when identifying individuals for additional
underwriting.
-
Manual and Spec+ scores show the loss ratio prediction of true risk to that reflected by your manual.
-
Claims+ and Spec Claims+ scores show if claims are predicted to come in higher or lower than the manual.
-
Profit+ and Spec profit + scores show if this group will be more profitable or less profitable than predicted by the manual.
The individual data tab also shows how many individuals fall into each segment, along with individual scores.
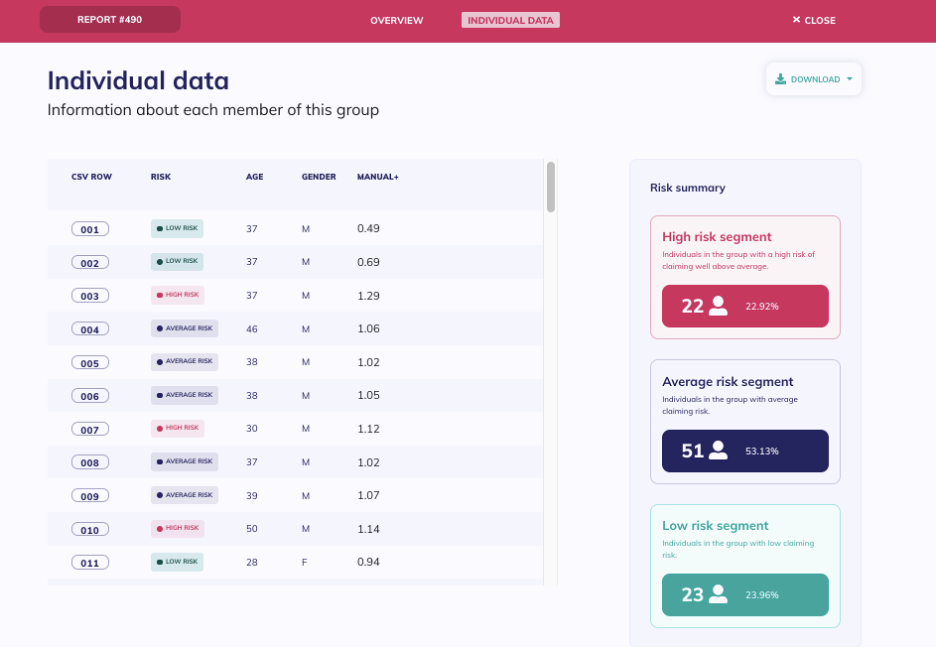
Downloads are available in both tabs; the group data is exported in PDF format. The individual and all group-level data exported as a CSV file under the individual export tab

For additional help, reach out to us via the Intercom chat or at support@verikai.com.
Did this answer your question?😞😐😃